Focus on Ler?
As I look at various pieces of the model (which I’ve started to assemble in lib/model.R), I realize that there are a sufficient number of ways in which the RIL data are different (and not yet analyzed) that I may find it challenging to exactly mirror the Ler model. In particular, I’m going to find it rather challenging (I think) to estimate the environmental stochasticity in seed production among generations and replicates.
So I think I should follow Jenn’s advice and focus in on a Ler model for now. That will simplify things as I will only have one genotype. But maybe I should go ahead and build in that extra array dimension anyway?
Ler seed stochasticity
Prior analysis
Back in June, I did some analysis on the Ler population data, using treatment C (unmanipulated) and B (solitary plants each generation), and using the 1p and 2p gaps. The idea was to look at seedling production in the home pot as a function of adult number, generation, and runway; the selection of landscapes was to get populations that were advancing (so that multiple pots were occupied and I could look at variation among pots within a runway), while having a numerically small effect of seed immigration on local seedling number. It took a bit of work to reconstruct my logic, so here it is in more detail:
There is a Gompertz relatinship between adult number (\(A\)) and seedling number (\(S\)): \[ \log(S_t / A_{t-1}) = a + b \log A_{t-1} + \epsilon_t, \] where \(\epsilon_t\) includes both environmental and demographic stochasticity.
This can be re-written as \[ \log S_t = a + (1+b) \log A_{t-1} + \epsilon_t. \] The RHS is what would go into a GLM with a log link function.
I ran a quasi-Poisson GLM including generation, runway, and their interaction as controls (to soak up putative environmental stochasticity), and found significant effects of those (as well as for the density dependence). The dispersion parameter was very large (75). The question was, is the residual variance plausibly demographic stochasticity alone, or is there additional variation among pots within a runway? I reasoned that, under a model of of demographic stochasticity, the variance of \(S/A\) should be proportional to \(1/A\). In order to do this analysis I had to remove the instances with a single pot in the runway (including all of the first generation), because the residual was, naturally, zero for those pots.
I ended that post saying that I needed to create the relevant data in a munge script, which I still haven’t done.
Quasi-Poisson RV
Thinking about modeling, I needed to get a way to simulate a quasi-Poisson random number. A couple of posts on R-bloggers (https://www.r-bloggers.com/generating-a-quasi-poisson-distribution-version-2/ and https://www.r-bloggers.com/generate-quasi-poisson-distribution-random-variable/) give the following solution:
rqpois <- function(n, mu, theta) {
  rnbinom(n = n, mu = mu, size = mu/(theta-1))
}
This creates a RV with the right mean-variance relationship; but I’m not sure what the shape looks like.
While doing that web research, I found a paper that notes that negative binomial is also commonly used for overdispersed count data; but the variance is a quadratic function of the mean. This can result in very different parameter estimates. Plotting an estimate of the variance against the mean can help decide which model to use.
Ver Hoef, J. M., and P. L. Boveng. 2007. Quasi-Poisson vs. negative binomial regression: how should we model overdispersed count data. Ecology 88:2766-2772.
Updated Ler fecundity data
I’ve created a script munge/Ler_fecundity.R to make and process the data (formerly called seed_data, but now called Ler_fecundity). Here is the current version of the code:
# Select the treatments
Ler_fecundity <- subset(popLer, Treatment %in% c("B", "C"))

# Create the lagged variable. For treatment B it is always 1
Ler_fecundity <- group_by(Ler_fecundity, ID, Pot) %>%
  mutate(Nm1 = 1 + (Treatment == "C") * (lag(Seedlings) - 1))

# Select the desired records
Ler_fecundity <- subset(Ler_fecundity,
                          Generation > 1 &
                          Gap %in% c("1p", "2p") &
                          !is.na(Nm1)
                        )

# Make the interaction variable
Ler_fecundity$GenID <- with(Ler_fecundity, interaction(Gen, ID))

# Drop cases where there is only one pot in a GenID level
GenID_counts <- table(Ler_fecundity$GenID)
singletons <- rownames(GenID_counts)[GenID_counts == 1]
Ler_fecundity <- droplevels(Ler_fecundity[-match(singletons, Ler_fecundity$GenID), ])

# Clean up and auto-cache the result
rm(singletons, GenID_counts)
ProjectTemplate::cache("Ler_fecundity")
I found that my previous analysis may have had some extraneous records where pots were newly colonized, so don’t be surprised if the results qualitatively change.
Also, because this does lots of subsetting, there may be situations where I want to use more of the data, in which case I’ll need to make two versions.
Re-run old analysis
Now let’s repeat the analysis from June 5.
DD.glm <- glm(Seedlings ~ log(Nm1) + Gen * ID, data = Ler_fecundity, family = quasipoisson)
car::Anova(DD.glm)
Analysis of Deviance Table (Type II tests)
Response: Seedlings
LR Chisq Df Pr(>Chisq)
log(Nm1) 169.666 1 < 2.2e-16 ***
Gen 202.935 4 < 2.2e-16 ***
ID 97.841 34 4.281e-08 ***
Gen:ID 186.686 95 6.108e-08 ***
---
Signif. codes: 0 '***' 0.001 '**' 0.01 '*' 0.05 '.' 0.1 ' ' 1summary(DD.glm)
Call:
glm(formula = Seedlings ~ log(Nm1) + Gen * ID, family = quasipoisson,
    data = Ler_fecundity)

Deviance Residuals:
     Min        1Q    Median        3Q       Max
-25.9255   -4.0579   -0.3621    2.9629   21.9147

Coefficients: (41 not defined because of singularities)
            Estimate Std. Error t value Pr(>|t|)
(Intercept)  6.59215    1.22560   5.379 1.64e-07 ***
log(Nm1)     0.23480    0.01967  11.937  < 2e-16 ***
Gen3        -1.61746    1.25583  -1.288   0.1989
Gen4        -1.43277    1.24305  -1.153   0.2501
Gen5        -2.24685    1.25386  -1.792   0.0743 .
Gen6        -2.21687    1.18647  -1.868   0.0628 .
ID2         -0.49600    0.45099  -1.100   0.2724
ID3         -0.04372    0.37810  -0.116   0.9080
ID8         -1.76040    1.25807  -1.399   0.1629
ID10        -2.13378    1.29818  -1.644   0.1014
ID12        -1.78912    1.25410  -1.427   0.1549
ID14        -2.21647    1.28493  -1.725   0.0857 .
ID16         0.13938    0.36224   0.385   0.7007
ID20        -2.24508    1.29111  -1.739   0.0832 .
ID24         0.11154    0.46630   0.239   0.8111
ID30         0.21962    0.42532   0.516   0.6060
ID37        -0.10184    0.38321  -0.266   0.7906
ID43        -1.62991    1.25026  -1.304   0.1935
ID45        -0.49956    0.42834  -1.166   0.2446
ID58        -2.00789    1.28779  -1.559   0.1201
ID64        -0.59030    0.40991  -1.440   0.1510
ID68        -2.16320    1.28478  -1.684   0.0934 .
ID69        -0.09341    0.37312  -0.250   0.8025
ID72        -1.67512    1.25393  -1.336   0.1827
ID74        -0.63760    0.93003  -0.686   0.4936
ID78        -0.79175    0.83290  -0.951   0.3427
ID80        -0.48345    0.73124  -0.661   0.5091
ID83        -0.66170    0.94008  -0.704   0.4821
ID85        -1.29950    1.04413  -1.245   0.2144
ID87        -2.50347    2.25243  -1.111   0.2674
ID90        -1.31188    0.83626  -1.569   0.1179
ID92        -2.53170    1.43531  -1.764   0.0789 .
ID97        -0.87877    1.03688  -0.848   0.3975
ID98        -2.77443    1.48775  -1.865   0.0633 .
ID100       -0.60251    0.91563  -0.658   0.5111
ID101       -4.57724    2.41190  -1.898   0.0588 .
ID104       -1.73622    1.11814  -1.553   0.1217
ID106       -1.63443    1.06695  -1.532   0.1267
ID110       -1.35485    1.29349  -1.047   0.2958
ID112       -1.26176    0.90198  -1.399   0.1630
Gen3:ID2          NA         NA      NA       NA
Gen4:ID2     0.67254    0.56274   1.195   0.2331
Gen5:ID2     0.60402    0.61090   0.989   0.3237
Gen6:ID2          NA         NA      NA       NA
Gen3:ID3          NA         NA      NA       NA
Gen4:ID3     0.24955    0.49648   0.503   0.6156
Gen5:ID3     0.59145    0.51894   1.140   0.2554
Gen6:ID3          NA         NA      NA       NA
Gen3:ID8     1.66799    1.31288   1.270   0.2050
Gen4:ID8     1.00160    1.30900   0.765   0.4449
Gen5:ID8     2.75587    1.30082   2.119   0.0351 *
Gen6:ID8     0.25457    1.32677   0.192   0.8480
Gen3:ID10    1.81944    1.37075   1.327   0.1855
Gen4:ID10    2.15058    1.33778   1.608   0.1091
Gen5:ID10    3.32715    1.33854   2.486   0.0135 *
Gen6:ID10    2.33048    1.28478   1.814   0.0708 .
Gen3:ID12    1.74737    1.30249   1.342   0.1809
Gen4:ID12    1.12410    1.29288   0.869   0.3854
Gen5:ID12    2.48176    1.29499   1.916   0.0564 .
Gen6:ID12    0.84291    1.25752   0.670   0.5032
Gen3:ID14    2.24478    1.34596   1.668   0.0965 .
Gen4:ID14    1.32017    1.35153   0.977   0.3296
Gen5:ID14    2.85155    1.32849   2.146   0.0327 *
Gen6:ID14    2.11305    1.27363   1.659   0.0983 .
Gen3:ID16   -0.11037    0.54529  -0.202   0.8398
Gen4:ID16   -1.31075    0.58220  -2.251   0.0252 *
Gen5:ID16    0.17678    0.51677   0.342   0.7326
Gen6:ID16         NA         NA      NA       NA
Gen3:ID20    1.91428    1.35194   1.416   0.1580
Gen4:ID20    2.20769    1.32275   1.669   0.0963 .
Gen5:ID20    3.29280    1.32905   2.478   0.0138 *
Gen6:ID20    2.19404    1.27252   1.724   0.0858 .
Gen3:ID24         NA         NA      NA       NA
Gen4:ID24         NA         NA      NA       NA
Gen5:ID24         NA         NA      NA       NA
Gen6:ID24         NA         NA      NA       NA
Gen3:ID30         NA         NA      NA       NA
Gen4:ID30         NA         NA      NA       NA
Gen5:ID30    0.14722    0.62936   0.234   0.8152
Gen6:ID30         NA         NA      NA       NA
Gen3:ID37   -0.67987    0.63239  -1.075   0.2833
Gen4:ID37    0.20797    0.50808   0.409   0.6826
Gen5:ID37    0.72804    0.52187   1.395   0.1642
Gen6:ID37         NA         NA      NA       NA
Gen3:ID43    1.63773    1.29667   1.263   0.2077
Gen4:ID43    1.73013    1.27871   1.353   0.1772
Gen5:ID43    2.55221    1.28852   1.981   0.0487 *
Gen6:ID43    0.66775    1.25290   0.533   0.5945
Gen3:ID45         NA         NA      NA       NA
Gen4:ID45    0.42664    0.53886   0.792   0.4292
Gen5:ID45    0.80714    0.56080   1.439   0.1513
Gen6:ID45         NA         NA      NA       NA
Gen3:ID58    2.35074    1.33623   1.759   0.0797 .
Gen4:ID58    1.73869    1.32381   1.313   0.1902
Gen5:ID58    3.01806    1.32805   2.273   0.0239 *
Gen6:ID58    1.87265    1.28092   1.462   0.1449
Gen3:ID64    1.11037    0.55105   2.015   0.0449 *
Gen4:ID64   -0.50266    0.58071  -0.866   0.3875
Gen5:ID64    0.83220    0.56150   1.482   0.1395
Gen6:ID64         NA         NA      NA       NA
Gen3:ID68    1.38139    1.36277   1.014   0.3117
Gen4:ID68    1.40125    1.33779   1.047   0.2958
Gen5:ID68    2.59539    1.33465   1.945   0.0529 .
Gen6:ID68    1.93467    1.28073   1.511   0.1321
Gen3:ID69    0.70291    0.51851   1.356   0.1764
Gen4:ID69   -1.26927    0.57221  -2.218   0.0274 *
Gen5:ID69    0.71429    0.51639   1.383   0.1678
Gen6:ID69         NA         NA      NA       NA
Gen3:ID72    1.95007    1.29924   1.501   0.1346
Gen4:ID72    0.75069    1.29335   0.580   0.5621
Gen5:ID72    2.00965    1.29675   1.550   0.1224
Gen6:ID72    0.72998    1.25402   0.582   0.5610
Gen3:ID74         NA         NA      NA       NA
Gen4:ID74         NA         NA      NA       NA
Gen5:ID74    0.79766    1.13695   0.702   0.4836
Gen6:ID74         NA         NA      NA       NA
Gen3:ID78         NA         NA      NA       NA
Gen4:ID78         NA         NA      NA       NA
Gen5:ID78         NA         NA      NA       NA
Gen6:ID78         NA         NA      NA       NA
Gen3:ID80         NA         NA      NA       NA
Gen4:ID80   -0.59838    1.06129  -0.564   0.5733
Gen5:ID80    1.28274    0.89079   1.440   0.1510
Gen6:ID80         NA         NA      NA       NA
Gen3:ID83   -0.43142    1.27517  -0.338   0.7354
Gen4:ID83    0.27724    1.09542   0.253   0.8004
Gen5:ID83   -0.59255    1.55721  -0.381   0.7039
Gen6:ID83         NA         NA      NA       NA
Gen3:ID85    0.08602    1.29111   0.067   0.9469
Gen4:ID85    0.37423    1.20248   0.311   0.7559
Gen5:ID85    0.22504    1.40699   0.160   0.8730
Gen6:ID85         NA         NA      NA       NA
Gen3:ID87         NA         NA      NA       NA
Gen4:ID87         NA         NA      NA       NA
Gen5:ID87         NA         NA      NA       NA
Gen6:ID87         NA         NA      NA       NA
Gen3:ID90    0.03850    1.25436   0.031   0.9755
Gen4:ID90   -1.48037    1.66287  -0.890   0.3741
Gen5:ID90    1.10972    1.01304   1.095   0.2743
Gen6:ID90         NA         NA      NA       NA
Gen3:ID92    0.94704    1.69186   0.560   0.5761
Gen4:ID92    0.87889    1.65845   0.530   0.5966
Gen5:ID92    3.35310    1.50108   2.234   0.0263 *
Gen6:ID92    1.58232    1.57859   1.002   0.3171
Gen3:ID97   -0.54057    1.44041  -0.375   0.7077
Gen4:ID97   -0.03211    1.25719  -0.026   0.9796
Gen5:ID97    0.29467    1.37762   0.214   0.8308
Gen6:ID97         NA         NA      NA       NA
Gen3:ID98    1.56095    1.74386   0.895   0.3715
Gen4:ID98    0.99379    1.72974   0.575   0.5661
Gen5:ID98    1.31951    1.78395   0.740   0.4602
Gen6:ID98    0.90469    1.85472   0.488   0.6261
Gen3:ID100  -0.46015    1.24926  -0.368   0.7129
Gen4:ID100  -0.94594    1.32520  -0.714   0.4760
Gen5:ID100   0.33475    1.20706   0.277   0.7817
Gen6:ID100        NA         NA      NA       NA
Gen3:ID101   3.68573    2.50118   1.474   0.1418
Gen4:ID101   3.46092    2.49777   1.386   0.1670
Gen5:ID101   3.59924    2.57514   1.398   0.1634
Gen6:ID101   3.83955    2.50812   1.531   0.1270
Gen3:ID104   0.95874    1.34607   0.712   0.4769
Gen4:ID104  -0.61980    1.80410  -0.344   0.7315
Gen5:ID104   1.17511    1.43383   0.820   0.4132
Gen6:ID104        NA         NA      NA       NA
Gen3:ID106   0.38545    1.41182   0.273   0.7851
Gen4:ID106   0.10384    1.32449   0.078   0.9376
Gen5:ID106   2.07106    1.17867   1.757   0.0800 .
Gen6:ID106        NA         NA      NA       NA
Gen3:ID110        NA         NA      NA       NA
Gen4:ID110        NA         NA      NA       NA
Gen5:ID110   0.79374    1.57440   0.504   0.6146
Gen6:ID110        NA         NA      NA       NA
Gen3:ID112  -0.05795    1.20273  -0.048   0.9616
Gen4:ID112  -0.34227    1.21371  -0.282   0.7782
Gen5:ID112   1.03279    1.11150   0.929   0.3536
Gen6:ID112        NA         NA      NA       NA
---
Signif. codes:  0 '***' 0.001 '**' 0.01 '*' 0.05 '.' 0.1 ' ' 1

(Dispersion parameter for quasipoisson family taken to be 64.72785)

    Null deviance: 110390  on 400  degrees of freedom
Residual deviance:  17852  on 266  degrees of freedom
AIC: NA

Number of Fisher Scoring iterations: 5
I still don’t understand the singularities (resulting in NAs in the coefficients); there is replication in all those cases. Maybe it’s because of a lack of balance—not all IDs have the same number of Gens. We can test that by using the interaction term directly:
DD.glm2 <- glm(Seedlings ~ log(Nm1) + GenID, data = Ler_fecundity, family = quasipoisson)
car::Anova(DD.glm2)
Analysis of Deviance Table (Type II tests)
Response: Seedlings
LR Chisq Df Pr(>Chisq)
log(Nm1) 169.67 1 < 2.2e-16 ***
GenID 514.17 133 < 2.2e-16 ***
---
Signif. codes: 0 '***' 0.001 '**' 0.01 '*' 0.05 '.' 0.1 ' ' 1summary(DD.glm2)
Call:
glm(formula = Seedlings ~ log(Nm1) + GenID, family = quasipoisson,
    data = Ler_fecundity)

Deviance Residuals:
     Min        1Q    Median        3Q       Max
-25.9255   -4.0579   -0.3621    2.9629   21.9147

Coefficients:
             Estimate Std. Error t value Pr(>|t|)
(Intercept)  4.974682   0.307561  16.175  < 2e-16 ***
log(Nm1)     0.234799   0.019669  11.937  < 2e-16 ***
GenID4.1     0.184691   0.374329   0.493 0.622143
GenID5.1    -0.629386   0.408860  -1.539 0.124903
GenID6.1    -0.599408   0.411564  -1.456 0.146457
GenID4.2     0.361231   0.381020   0.948 0.343958
GenID5.2    -0.521369   0.418139  -1.247 0.213539
GenID6.2    -1.095412   0.453551  -2.415 0.016402 *
GenID4.3     0.390519   0.368027   1.061 0.289601
GenID5.3    -0.081652   0.362791  -0.225 0.822100
GenID6.3    -0.643126   0.381678  -1.685 0.093162 .
GenID2.8    -0.142941   0.421201  -0.339 0.734603
GenID3.8    -0.092411   0.375235  -0.246 0.805659
GenID4.8    -0.574112   0.403526  -1.423 0.155983
GenID5.8     0.366076   0.338387   1.082 0.280310
GenID6.8    -2.105241   0.589175  -3.573 0.000419 ***
GenID2.10   -0.516316   0.528433  -0.977 0.329422
GenID3.10   -0.314341   0.440143  -0.714 0.475743
GenID4.10    0.201492   0.369368   0.546 0.585864
GenID5.10    0.563980   0.333794   1.690 0.092275 .
GenID6.10   -0.402705   0.365029  -1.103 0.270931
GenID2.12   -0.171658   0.408621  -0.420 0.674757
GenID3.12   -0.041749   0.351177  -0.119 0.905458
GenID4.12   -0.480328   0.361337  -1.329 0.184885
GenID5.12    0.063251   0.330752   0.191 0.848488
GenID6.12   -1.545617   0.421358  -3.668 0.000295 ***
GenID2.14   -0.599004   0.495651  -1.209 0.227921
GenID3.14    0.028314   0.400638   0.071 0.943711
GenID4.14   -0.711604   0.455751  -1.561 0.119621
GenID5.14    0.005698   0.344745   0.017 0.986826
GenID6.14   -0.702826   0.374856  -1.875 0.061899 .
GenID3.16    0.029014   0.407639   0.071 0.943311
GenID4.16   -0.986675   0.489971  -2.014 0.045044 *
GenID5.16   -0.313229   0.374141  -0.837 0.403235
GenID6.16   -0.460026   0.365931  -1.257 0.209806
GenID2.20   -0.627619   0.511221  -1.228 0.220650
GenID3.20   -0.330804   0.401192  -0.825 0.410365
GenID4.20    0.147300   0.338871   0.435 0.664147
GenID5.20    0.418330   0.323247   1.294 0.196736
GenID6.20   -0.650454   0.348380  -1.867 0.062990 .
GenID6.24   -0.487866   0.468964  -1.040 0.299143
GenID5.30   -0.262549   0.468251  -0.561 0.575473
GenID6.30   -0.379786   0.428291  -0.887 0.376016
GenID3.37   -0.781701   0.503115  -1.554 0.121439
GenID4.37    0.290822   0.377864   0.770 0.442191
GenID5.37   -0.003184   0.361443  -0.009 0.992978
GenID6.37   -0.701244   0.386721  -1.813 0.070911 .
GenID2.43   -0.012446   0.396527  -0.031 0.974983
GenID3.43    0.007815   0.343613   0.023 0.981871
GenID4.43    0.284911   0.322225   0.884 0.377387
GenID5.43    0.292914   0.319001   0.918 0.359334
GenID6.43   -1.561569   0.418034  -3.736 0.000229 ***
GenID4.45    0.111773   0.371514   0.301 0.763758
GenID5.45   -0.321808   0.369445  -0.871 0.384508
GenID6.45   -1.098965   0.431430  -2.547 0.011421 *
GenID2.58   -0.390431   0.502433  -0.777 0.437802
GenID3.58    0.342850   0.357211   0.960 0.338029
GenID4.58   -0.084512   0.354485  -0.238 0.811747
GenID5.58    0.380781   0.331615   1.148 0.251892
GenID6.58   -0.734654   0.387655  -1.895 0.059160 .
GenID3.64    0.520068   0.368298   1.412 0.159094
GenID4.64   -0.908268   0.448705  -2.024 0.043949 *
GenID5.64   -0.387489   0.389900  -0.994 0.321216
GenID6.64   -1.189712   0.413063  -2.880 0.004298 **
GenID2.68   -0.545736   0.494984  -1.103 0.271227
GenID3.68   -0.781806   0.454553  -1.720 0.086606 .
GenID4.68   -0.577255   0.413826  -1.395 0.164204
GenID5.68   -0.197196   0.368494  -0.535 0.593000
GenID6.68   -0.827938   0.398562  -2.077 0.038732 *
GenID3.69    0.609499   0.359979   1.693 0.091598 .
GenID4.69   -1.177989   0.469703  -2.508 0.012740 *
GenID5.69   -0.008508   0.363159  -0.023 0.981327
GenID6.69   -0.692815   0.376897  -1.838 0.067146 .
GenID2.72   -0.057654   0.408606  -0.141 0.887899
GenID3.72    0.274955   0.340037   0.809 0.419467
GenID4.72   -0.739733   0.363964  -2.032 0.043103 *
GenID5.72   -0.294853   0.338064  -0.872 0.383895
GenID6.72   -1.544547   0.411826  -3.750 0.000217 ***
GenID5.74   -0.469332   0.672463  -0.698 0.485831
GenID6.74   -1.237012   0.930142  -1.330 0.184685
GenID6.78   -1.391163   0.833022  -1.670 0.096092 .
GenID4.80   -0.897144   0.801957  -1.119 0.264280
GenID5.80    0.169902   0.532264   0.319 0.749821
GenID6.80   -1.082861   0.731382  -1.481 0.139905
GenID3.83   -1.093118   0.872864  -1.252 0.211548
GenID4.83   -0.199769   0.606389  -0.329 0.742082
GenID5.83   -1.883639   1.251272  -1.505 0.133413
GenID6.83   -1.261110   0.940190  -1.341 0.180956
GenID3.85   -1.213482   0.772244  -1.571 0.117285
GenID4.85   -0.740575   0.638192  -1.160 0.246915
GenID5.85   -1.703846   0.955999  -1.782 0.075846 .
GenID6.85   -1.898907   1.044226  -1.818 0.070115 .
GenID6.87   -3.102880   2.252478  -1.378 0.169503
GenID3.90   -1.273380   0.945359  -1.347 0.179133
GenID4.90   -2.607558   1.455108  -1.792 0.074269 .
GenID5.90   -0.831547   0.592833  -1.403 0.161882
GenID6.90   -1.911291   0.836377  -2.285 0.023088 *
GenID2.92   -0.914239   0.807832  -1.132 0.258772
GenID3.92   -1.584658   0.906572  -1.748 0.081624 .
GenID4.92   -1.468124   0.861320  -1.705 0.089455 .
GenID5.92    0.192007   0.466531   0.412 0.680990
GenID6.92   -1.548792   0.787932  -1.966 0.050380 .
GenID3.97   -1.419334   1.009593  -1.406 0.160936
GenID4.97   -0.726186   0.746281  -0.973 0.331401
GenID5.97   -1.213482   0.920458  -1.318 0.188522
GenID6.97   -1.478174   1.036976  -1.425 0.155195
GenID2.98   -1.156969   0.897712  -1.289 0.198588
GenID3.98   -1.213482   0.920458  -1.318 0.188522
GenID4.98   -1.595957   0.911119  -1.752 0.080987 .
GenID5.98   -2.084310   0.996791  -2.091 0.037475 *
GenID6.98   -2.469156   1.189776  -2.075 0.038919 *
GenID3.100  -1.062659   0.861320  -1.234 0.218383
GenID4.100  -1.363764   0.984528  -1.385 0.167153
GenID5.100  -0.897144   0.801956  -1.119 0.264279
GenID6.100  -1.201921   0.915744  -1.313 0.190481
GenID2.101  -2.959779   2.099943  -1.409 0.159868
GenID3.101  -0.891510   0.676930  -1.317 0.188975
GenID4.101  -0.931630   0.687837  -1.354 0.176747
GenID5.101  -1.607386   0.915747  -1.755 0.080364 .
GenID6.101  -1.337096   0.813869  -1.643 0.101587
GenID2.104  -0.118753   0.588603  -0.202 0.840263
GenID3.104  -0.777480   0.762410  -1.020 0.308766
GenID4.104  -2.171321   1.433891  -1.514 0.131141
GenID5.104  -1.190492   0.911119  -1.307 0.192468
GenID6.104  -2.335624   1.118234  -2.089 0.037688 *
GenID3.106  -1.248988   0.935119  -1.336 0.182807
GenID4.106  -1.345906   0.816950  -1.647 0.100641
GenID5.106  -0.192761   0.524784  -0.367 0.713676
GenID6.106  -2.233842   1.067047  -2.093 0.037253 *
GenID5.110  -1.190492   0.911119  -1.307 0.192468
GenID6.110  -1.954257   1.293569  -1.511 0.132040
GenID3.112  -1.319704   0.807832  -1.634 0.103518
GenID4.112  -1.419334   0.843238  -1.683 0.093511 .
GenID5.112  -0.858358   0.668114  -1.285 0.199998
GenID6.112  -1.861166   0.902096  -2.063 0.040068 *
---
Signif. codes:  0 '***' 0.001 '**' 0.01 '*' 0.05 '.' 0.1 ' ' 1

(Dispersion parameter for quasipoisson family taken to be 64.72785)

    Null deviance: 110390  on 400  degrees of freedom
Residual deviance:  17852  on 266  degrees of freedom
AIC: NA

Number of Fisher Scoring iterations: 5
Yes, that’s it. The model fit is the same, but the NAs have gone away.
Now let’s look again at the evidence for demographic stochasticity.
Ler_fecundity$Fitted <- fitted(DD.glm)
Ler_fecundity <- mutate(Ler_fecundity,
                           resid2 = ((Seedlings/Nm1) - (Fitted/Nm1))^2)
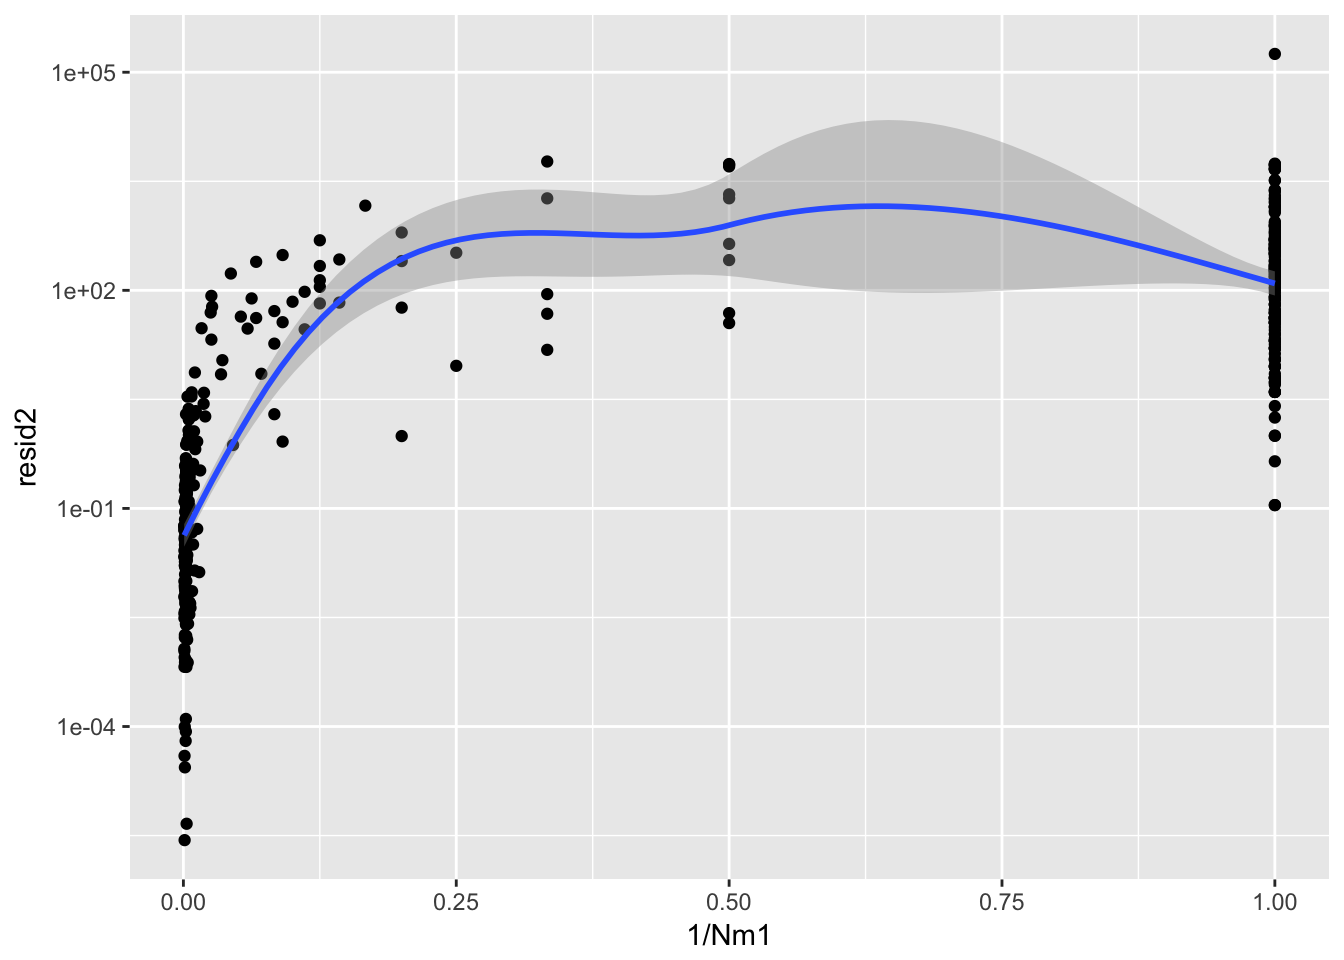
ggplot(aes(1/Nm1, resid2), data = Ler_fecundity) + geom_point() + scale_y_log10() +
  geom_smooth()
`geom_smooth()` using method = 'loess'
summary(lm(resid2 ~ I(1/Nm1), data = Ler_fecundity))
Call:
lm(formula = resid2 ~ I(1/Nm1), data = Ler_fecundity)

Residuals:
   Min     1Q Median     3Q    Max
 -1779  -1455    -43    -36 176864

Coefficients:
            Estimate Std. Error t value Pr(>|t|)
(Intercept)    33.01     601.40   0.055    0.956
I(1/Nm1)     1746.38     936.53   1.865    0.063 .
---
Signif. codes:  0 '***' 0.001 '**' 0.01 '*' 0.05 '.' 0.1 ' ' 1

Residual standard error: 8931 on 399 degrees of freedom
Multiple R-squared:  0.008639,  Adjusted R-squared:  0.006155
F-statistic: 3.477 on 1 and 399 DF,  p-value: 0.06295
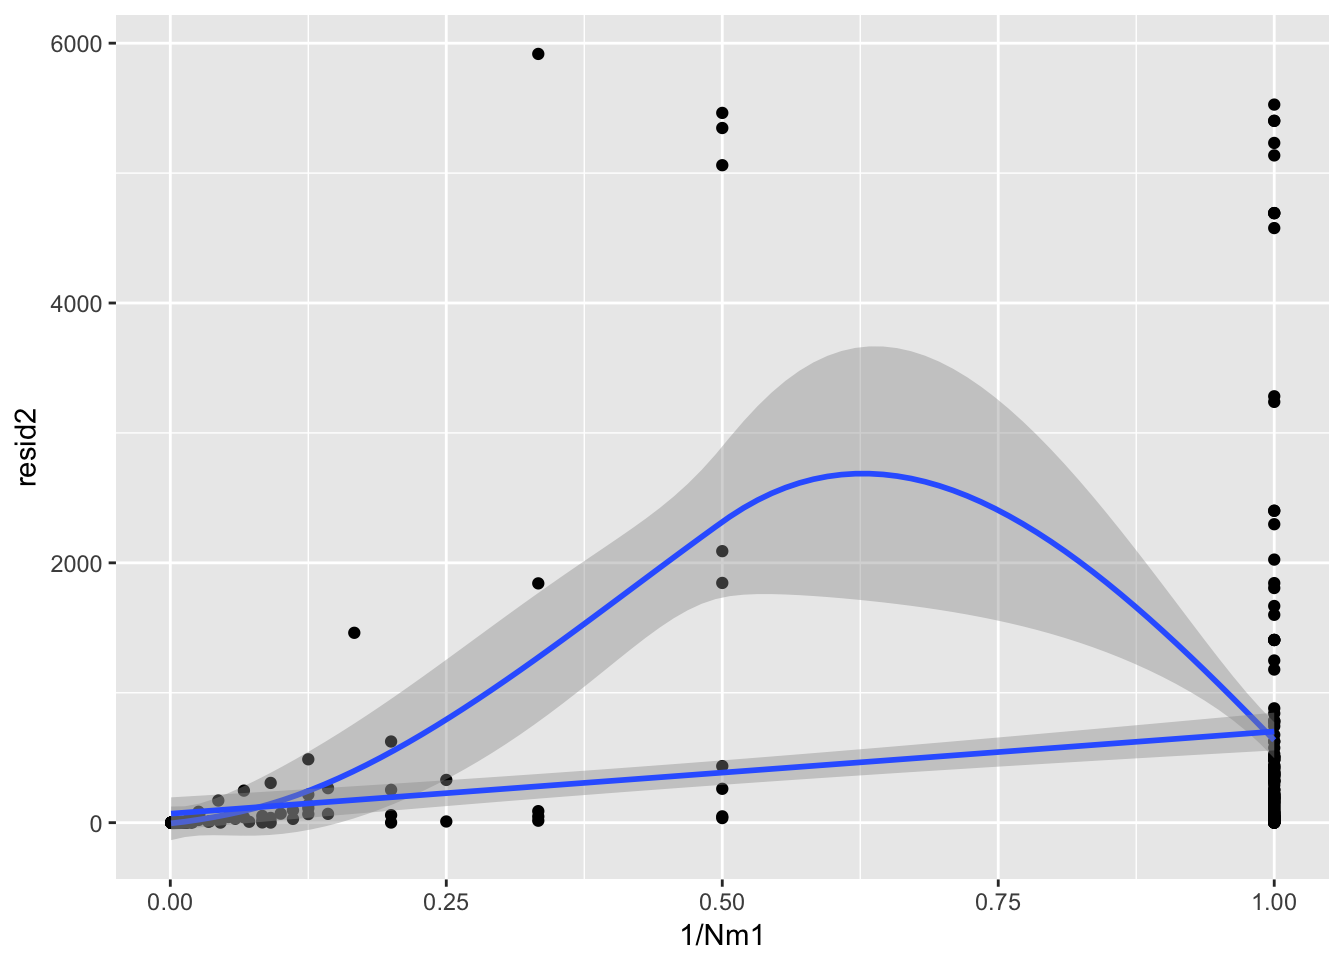
ggplot(aes(1/Nm1, resid2), data = subset(Ler_fecundity, resid2 < 10000)) + geom_point() +
geom_smooth() + geom_smooth(method = "lm")`geom_smooth()` using method = 'loess'
There is a bit of extra variance inflation around Nm1 = 2, it appears—I’m not sure what to do with that.
Mean-variance relationship
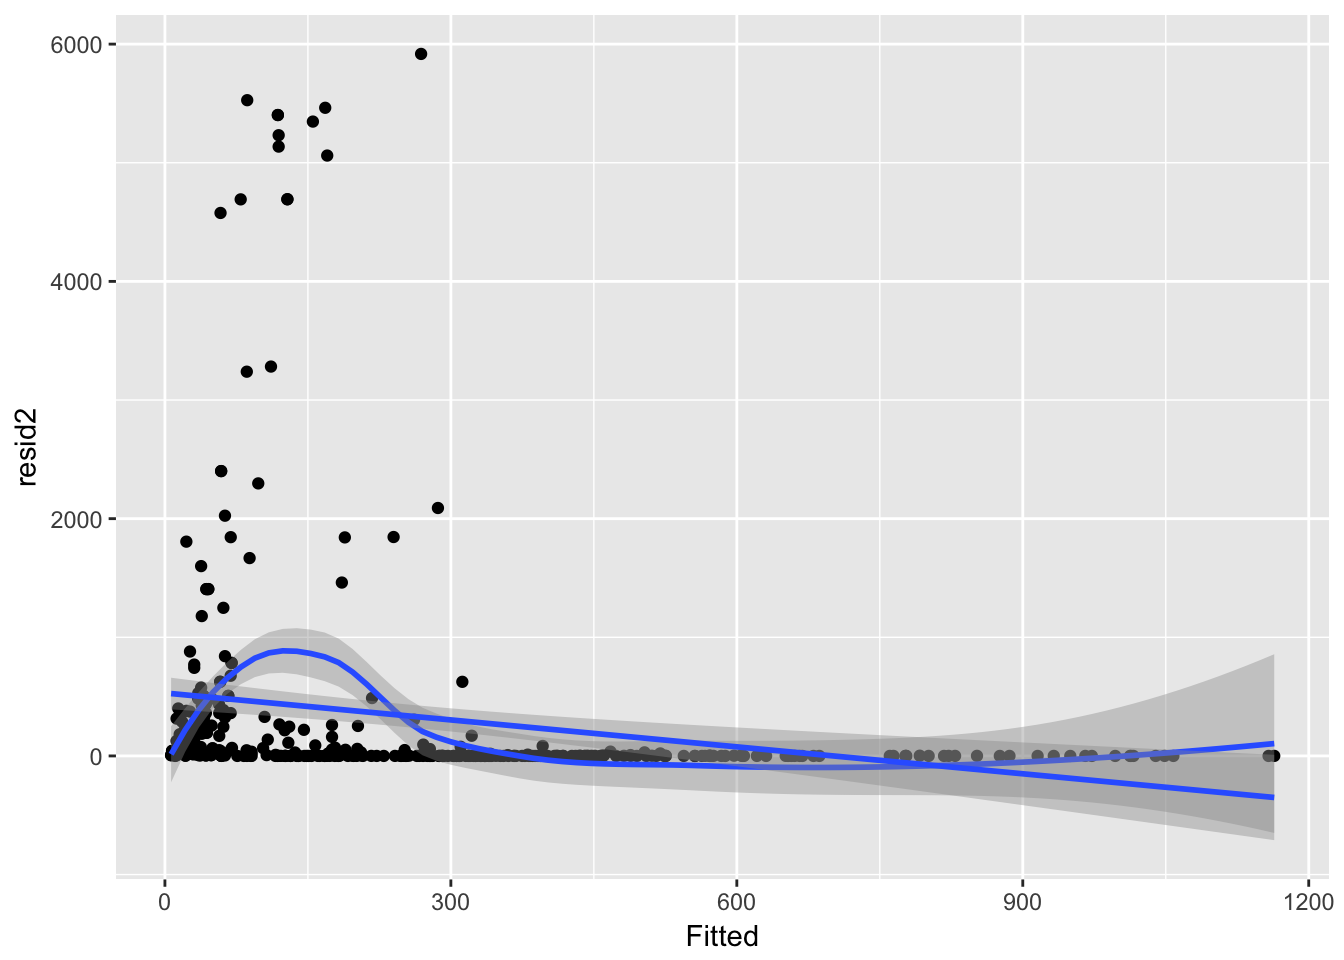
So if we plot the variance against the fitted values, what is the pattern?
ggplot(aes(Fitted, resid2), data = subset(Ler_fecundity, resid2 < 10000)) + geom_point() +
  geom_smooth() + geom_smooth(method = "lm")
`geom_smooth()` using method = 'loess'
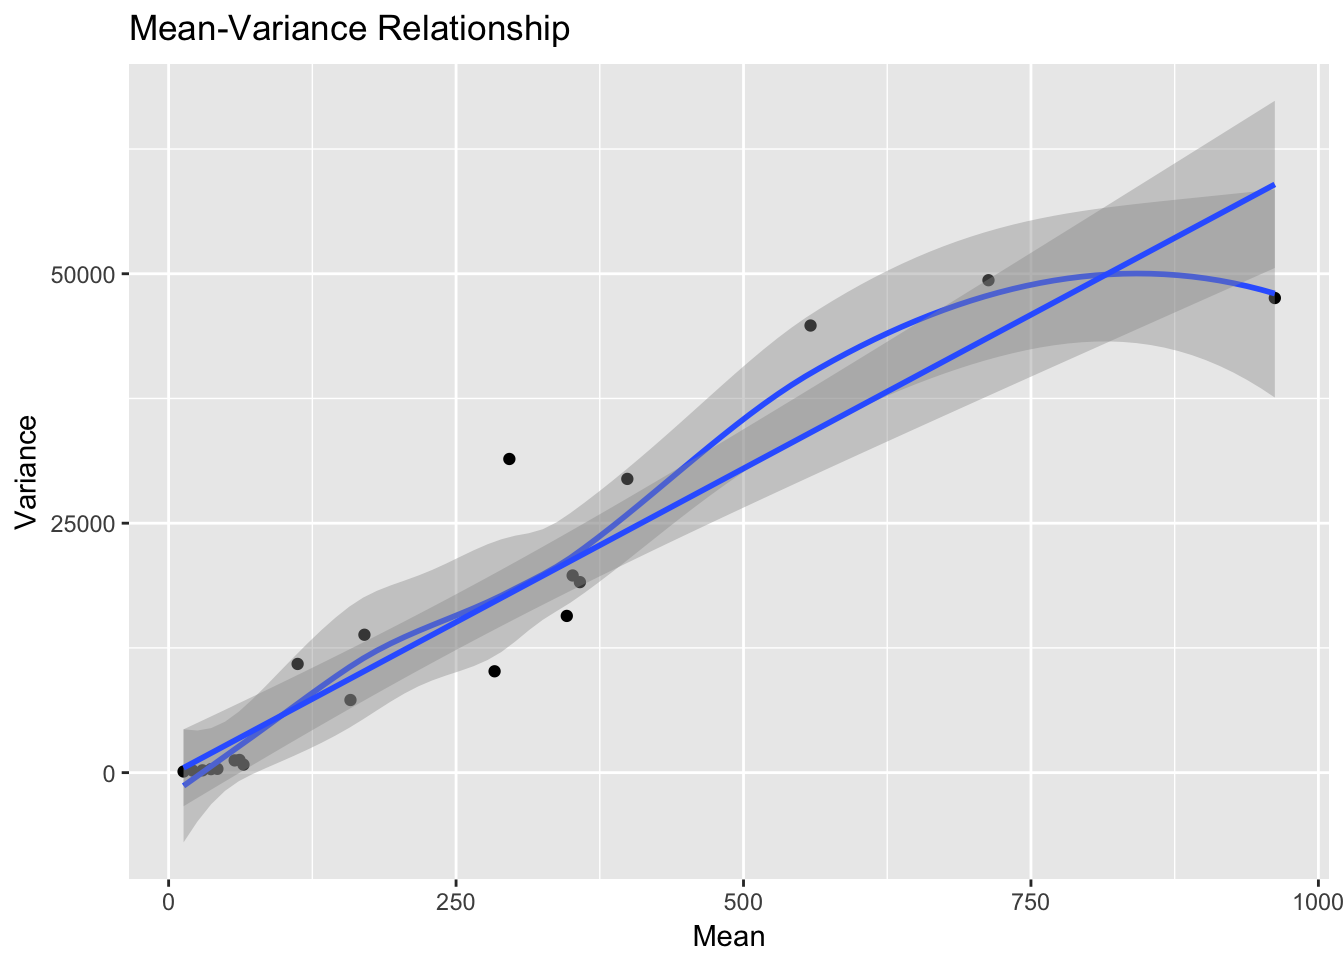
Hmm, there’s something very odd here. Let’s try binning the data, using a trick from http://data.princeton.edu/wws509/r/overdispersion.html.
xb <- Ler_fecundity$Fitted
g <- cut(xb, breaks=quantile(xb,seq(0,100,5)/100))
m <- tapply(Ler_fecundity$Seedlings, g, mean)
v <- tapply(Ler_fecundity$Seedlings, g, var)
qplot(m, v, xlab="Mean", ylab="Variance", main="Mean-Variance Relationship") +
  geom_smooth() + geom_smooth(method = "lm")
`geom_smooth()` using method = 'loess'
That’s pretty darn close to linear!