Ler analysis
I’ve got the complete set of gen 6 spread distances now. For a few of them there are some crazy high dispersal distances, so it can be easier to trim the most extreme ones
options(tibble.print_max = Inf)
Ler_spread_stats %>% group_by(Gap, DS, ES, KS, SS) %>%
  summarize(Mean = mean(Max_Dist), Var = var(Max_Dist))
# A tibble: 64 x 7
# Groups: Gap, DS, ES, KS [?]
Gap DS ES KS SS Mean Var
<int> <lgl> <lgl> <lgl> <lgl> <dbl> <dbl>
1 0 FALSE FALSE FALSE FALSE 14 0
2 0 FALSE FALSE FALSE TRUE 15.1 1.17
3 0 FALSE FALSE TRUE FALSE 16.2 1.70
4 0 FALSE FALSE TRUE TRUE 24.7 493379.
5 0 FALSE TRUE FALSE FALSE 15.0 0.960
6 0 FALSE TRUE FALSE TRUE 15.2 1.42
7 0 FALSE TRUE TRUE FALSE 16.2 2.19
8 0 FALSE TRUE TRUE TRUE 18.7 7064.
9 0 TRUE FALSE FALSE FALSE 14.6 0.821
10 0 TRUE FALSE FALSE TRUE 14.8 1.34
11 0 TRUE FALSE TRUE FALSE 15.7 1.93
12 0 TRUE FALSE TRUE TRUE 17.1 38.9
13 0 TRUE TRUE FALSE FALSE 14.7 1.65
14 0 TRUE TRUE FALSE TRUE 14.7 2.08
15 0 TRUE TRUE TRUE FALSE 15.6 2.99
16 0 TRUE TRUE TRUE TRUE 17.6 493.
17 1 FALSE FALSE FALSE FALSE 13 0
18 1 FALSE FALSE FALSE TRUE 13.1 0.271
19 1 FALSE FALSE TRUE FALSE 13.6 1.20
20 1 FALSE FALSE TRUE TRUE 14.1 69.3
21 1 FALSE TRUE FALSE FALSE 13.0 0.00240
22 1 FALSE TRUE FALSE TRUE 13.0 0.671
23 1 FALSE TRUE TRUE FALSE 13.7 1.84
24 1 FALSE TRUE TRUE TRUE 14.1 164.
25 1 TRUE FALSE FALSE FALSE 13.0 0.0918
26 1 TRUE FALSE FALSE TRUE 12.8 0.812
27 1 TRUE FALSE TRUE FALSE 13.3 1.52
28 1 TRUE FALSE TRUE TRUE 13.7 339.
29 1 TRUE TRUE FALSE FALSE 12.5 1.14
30 1 TRUE TRUE FALSE TRUE 12.3 2.03
31 1 TRUE TRUE TRUE FALSE 13.0 3.17
32 1 TRUE TRUE TRUE TRUE 13.8 3053.
33 2 FALSE FALSE FALSE FALSE 10 0
34 2 FALSE FALSE FALSE TRUE 8.61 7.19
35 2 FALSE FALSE TRUE FALSE 10.4 8.25
36 2 FALSE FALSE TRUE TRUE 9.79 10.8
37 2 FALSE TRUE FALSE FALSE 9.36 5.75
38 2 FALSE TRUE FALSE TRUE 8.83 8.15
39 2 FALSE TRUE TRUE FALSE 10.3 9.25
40 2 FALSE TRUE TRUE TRUE 9.85 15.9
41 2 TRUE FALSE FALSE FALSE 8.88 4.21
42 2 TRUE FALSE FALSE TRUE 8.06 7.50
43 2 TRUE FALSE TRUE FALSE 9.62 8.21
44 2 TRUE FALSE TRUE TRUE 9.21 12.1
45 2 TRUE TRUE FALSE FALSE 8.83 7.62
46 2 TRUE TRUE FALSE TRUE 8.20 8.70
47 2 TRUE TRUE TRUE FALSE 9.45 9.84
48 2 TRUE TRUE TRUE TRUE 9.25 49.9
49 3 FALSE FALSE FALSE FALSE 1 0
50 3 FALSE FALSE FALSE TRUE 1.47 1.78
51 3 FALSE FALSE TRUE FALSE 3.34 7.02
52 3 FALSE FALSE TRUE TRUE 4.03 9.65
53 3 FALSE TRUE FALSE FALSE 1.00 0.00480
54 3 FALSE TRUE FALSE TRUE 1.64 2.40
55 3 FALSE TRUE TRUE FALSE 3.76 8.08
56 3 FALSE TRUE TRUE TRUE 4.24 11.1
57 3 TRUE FALSE FALSE FALSE 1 0
58 3 TRUE FALSE FALSE TRUE 1.49 1.85
59 3 TRUE FALSE TRUE FALSE 3.27 6.84
60 3 TRUE FALSE TRUE TRUE 3.88 18.3
61 3 TRUE TRUE FALSE FALSE 1.00 0.00162
62 3 TRUE TRUE FALSE TRUE 1.62 2.27
63 3 TRUE TRUE TRUE FALSE 3.61 7.96
64 3 TRUE TRUE TRUE TRUE 4.04 10.5 filter(Ler_spread_stats, Max_Dist < 60) %>% group_by(Gap, DS, ES, KS, SS) %>%
summarize(Mean = mean(Max_Dist), Var = var(Max_Dist))# A tibble: 64 x 7
# Groups: Gap, DS, ES, KS [?]
Gap DS ES KS SS Mean Var
<int> <lgl> <lgl> <lgl> <lgl> <dbl> <dbl>
1 0 FALSE FALSE FALSE FALSE 14 0
2 0 FALSE FALSE FALSE TRUE 15.1 1.17
3 0 FALSE FALSE TRUE FALSE 16.2 1.70
4 0 FALSE FALSE TRUE TRUE 17.3 10.9
5 0 FALSE TRUE FALSE FALSE 15.0 0.960
6 0 FALSE TRUE FALSE TRUE 15.2 1.42
7 0 FALSE TRUE TRUE FALSE 16.2 2.19
8 0 FALSE TRUE TRUE TRUE 17.4 13.7
9 0 TRUE FALSE FALSE FALSE 14.6 0.821
10 0 TRUE FALSE FALSE TRUE 14.8 1.34
11 0 TRUE FALSE TRUE FALSE 15.7 1.93
12 0 TRUE FALSE TRUE TRUE 16.9 12.4
13 0 TRUE TRUE FALSE FALSE 14.7 1.65
14 0 TRUE TRUE FALSE TRUE 14.7 2.08
15 0 TRUE TRUE TRUE FALSE 15.6 2.99
16 0 TRUE TRUE TRUE TRUE 16.8 14.1
17 1 FALSE FALSE FALSE FALSE 13 0
18 1 FALSE FALSE FALSE TRUE 13.1 0.271
19 1 FALSE FALSE TRUE FALSE 13.6 1.20
20 1 FALSE FALSE TRUE TRUE 14.0 4.97
21 1 FALSE TRUE FALSE FALSE 13.0 0.00240
22 1 FALSE TRUE FALSE TRUE 13.0 0.671
23 1 FALSE TRUE TRUE FALSE 13.7 1.84
24 1 FALSE TRUE TRUE TRUE 13.9 6.73
25 1 TRUE FALSE FALSE FALSE 13.0 0.0918
26 1 TRUE FALSE FALSE TRUE 12.8 0.812
27 1 TRUE FALSE TRUE FALSE 13.3 1.52
28 1 TRUE FALSE TRUE TRUE 13.5 5.89
29 1 TRUE TRUE FALSE FALSE 12.5 1.14
30 1 TRUE TRUE FALSE TRUE 12.3 2.03
31 1 TRUE TRUE TRUE FALSE 13.0 3.17
32 1 TRUE TRUE TRUE TRUE 13.2 7.65
33 2 FALSE FALSE FALSE FALSE 10 0
34 2 FALSE FALSE FALSE TRUE 8.61 7.19
35 2 FALSE FALSE TRUE FALSE 10.4 8.25
36 2 FALSE FALSE TRUE TRUE 9.78 10.4
37 2 FALSE TRUE FALSE FALSE 9.36 5.75
38 2 FALSE TRUE FALSE TRUE 8.83 8.15
39 2 FALSE TRUE TRUE FALSE 10.3 9.25
40 2 FALSE TRUE TRUE TRUE 9.80 11.8
41 2 TRUE FALSE FALSE FALSE 8.88 4.21
42 2 TRUE FALSE FALSE TRUE 8.06 7.50
43 2 TRUE FALSE TRUE FALSE 9.62 8.21
44 2 TRUE FALSE TRUE TRUE 9.19 10.8
45 2 TRUE TRUE FALSE FALSE 8.83 7.62
46 2 TRUE TRUE FALSE TRUE 8.20 8.70
47 2 TRUE TRUE TRUE FALSE 9.45 9.84
48 2 TRUE TRUE TRUE TRUE 9.15 12.7
49 3 FALSE FALSE FALSE FALSE 1 0
50 3 FALSE FALSE FALSE TRUE 1.47 1.78
51 3 FALSE FALSE TRUE FALSE 3.34 7.02
52 3 FALSE FALSE TRUE TRUE 4.03 9.65
53 3 FALSE TRUE FALSE FALSE 1.00 0.00480
54 3 FALSE TRUE FALSE TRUE 1.64 2.40
55 3 FALSE TRUE TRUE FALSE 3.76 8.08
56 3 FALSE TRUE TRUE TRUE 4.23 10.2
57 3 TRUE FALSE FALSE FALSE 1 0
58 3 TRUE FALSE FALSE TRUE 1.49 1.85
59 3 TRUE FALSE TRUE FALSE 3.27 6.84
60 3 TRUE FALSE TRUE TRUE 3.86 9.46
61 3 TRUE TRUE FALSE FALSE 1.00 0.00162
62 3 TRUE TRUE FALSE TRUE 1.62 2.27
63 3 TRUE TRUE TRUE FALSE 3.61 7.96
64 3 TRUE TRUE TRUE TRUE 4.03 10.0 Here are the data values for the differnet landscapes
real_stats <- filter(LerC_spread, Generation==6) %>% group_by(Gap) %>%
  summarize(Mean = mean(Furthest), Var = var(Furthest))
real_stats
# A tibble: 4 x 3
Gap Mean Var
<fct> <dbl> <dbl>
1 0p 14 14.4
2 1p 8.6 4.49
3 2p 6.3 12.9
4 3p 3.56 5.78Ler_summ <- filter(Ler_spread_stats, Max_Dist < 60) %>% group_by(Gap, DS, ES, KS, SS) %>%
summarize(Mean = mean(Max_Dist), Variance = var(Max_Dist)) %>%
mutate(DS2 = paste("DS =", DS),
ES2 = paste("ES =", ES))
ggplot(filter(Ler_summ, Gap == 0),
aes(y = Mean, x = KS, fill = SS)) +
geom_bar(position="dodge", stat="identity") +
facet_grid(DS2 ~ ES2) +
ggtitle("Mean, continuous landscape") +
geom_hline(yintercept = pull(filter(real_stats, Gap == "0p"), Mean))
ggplot(filter(Ler_summ, Gap == 0),
       aes(y = Variance, x = KS, fill = SS)) +
  geom_bar(position="dodge", stat="identity") +
  facet_grid(DS2 ~ ES2) +
  ggtitle("Variance, continuous landscape") +
  geom_hline(yintercept = pull(filter(real_stats, Gap == "0p"), Var))
ggplot(filter(Ler_summ, Gap == 1),
       aes(y = Mean, x = KS, fill = SS)) +
  geom_bar(position="dodge", stat="identity") +
  facet_grid(DS2 ~ ES2) +
  ggtitle("Mean, 1-pot gaps") +
  geom_hline(yintercept = pull(filter(real_stats, Gap == "1p"), Mean))
ggplot(filter(Ler_summ, Gap == 1),
       aes(y = Variance, x = KS, fill = SS)) +
  geom_bar(position="dodge", stat="identity") +
  facet_grid(DS2 ~ ES2) +
  ggtitle("Variance, 1-pot gaps") +
  geom_hline(yintercept = pull(filter(real_stats, Gap == "1p"), Var))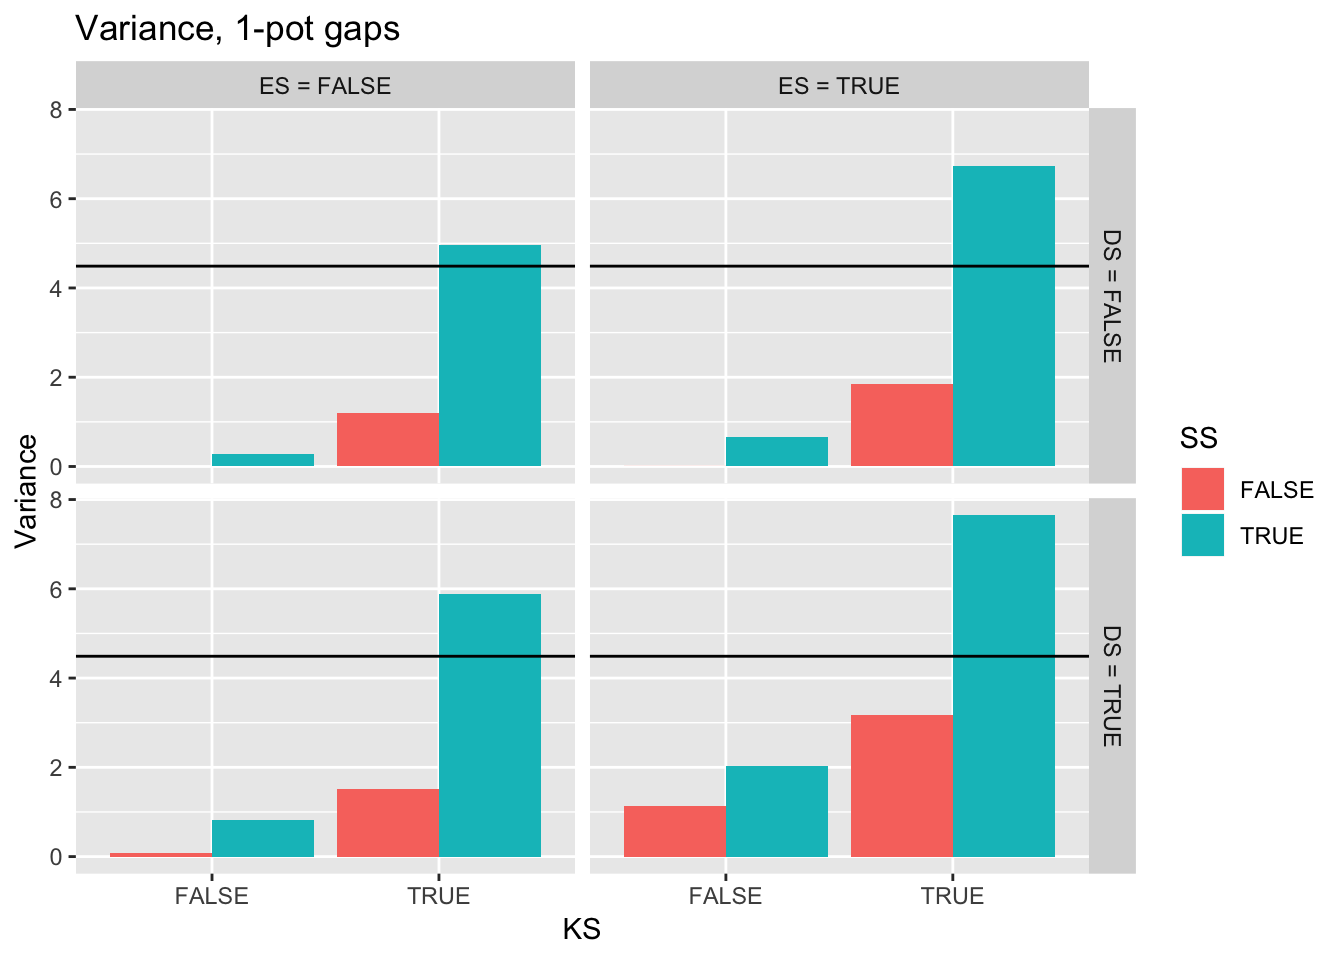
ggplot(filter(Ler_summ, Gap == 2),
       aes(y = Mean, x = KS, fill = SS)) +
  geom_bar(position="dodge", stat="identity") +
  facet_grid(DS2 ~ ES2) +
  ggtitle("Mean, 2-pot gaps") +
  geom_hline(yintercept = pull(filter(real_stats, Gap == "2p"), Mean))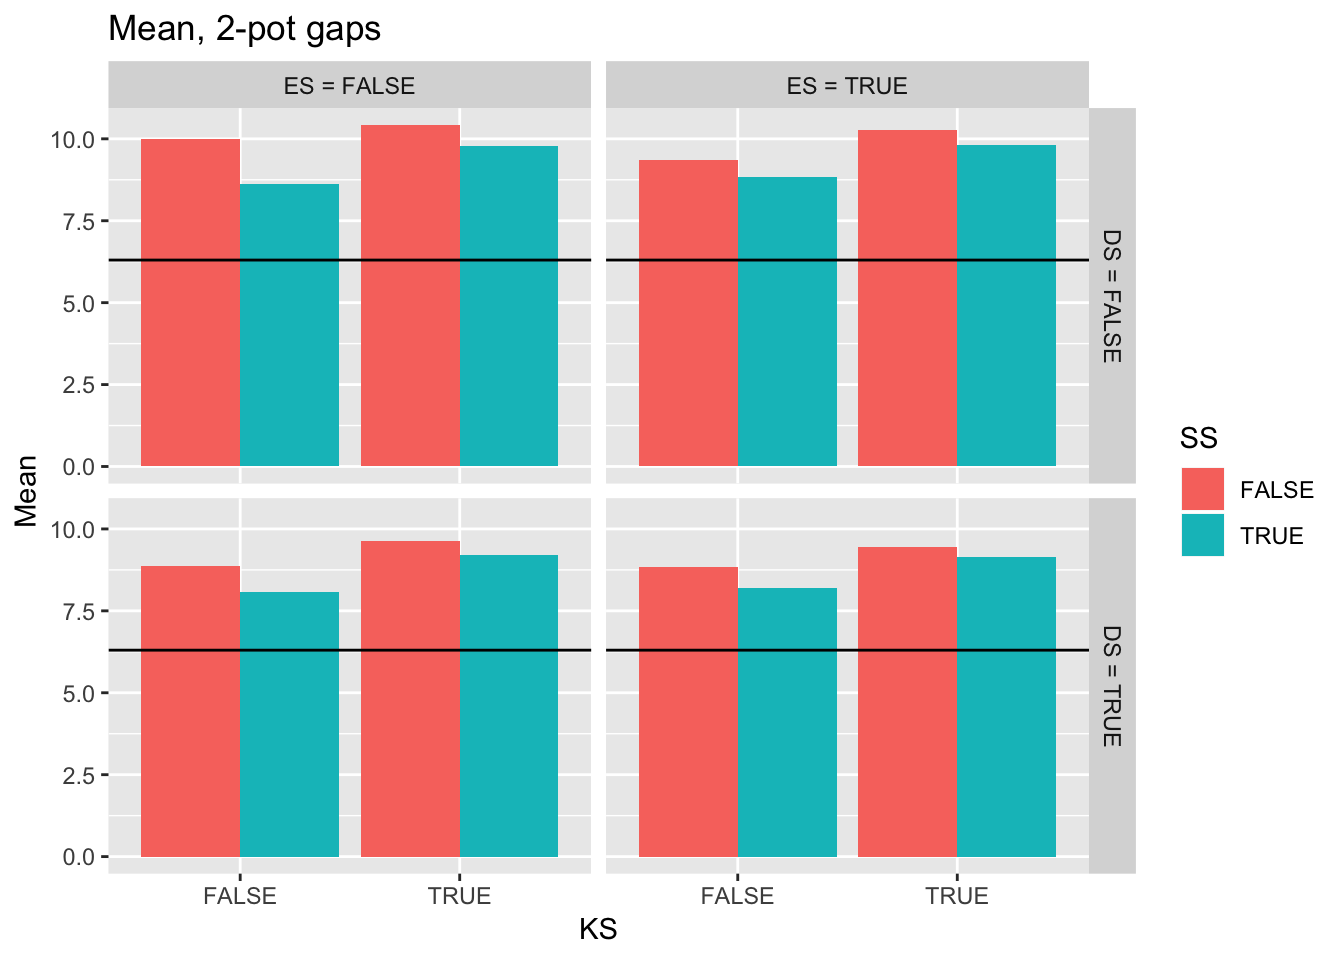
ggplot(filter(Ler_summ, Gap == 2),
       aes(y = Variance, x = KS, fill = SS)) +
  geom_bar(position="dodge", stat="identity") +
  facet_grid(DS2 ~ ES2) +
  ggtitle("Variance, 2-pot gaps") +
  geom_hline(yintercept = pull(filter(real_stats, Gap == "2p"), Var))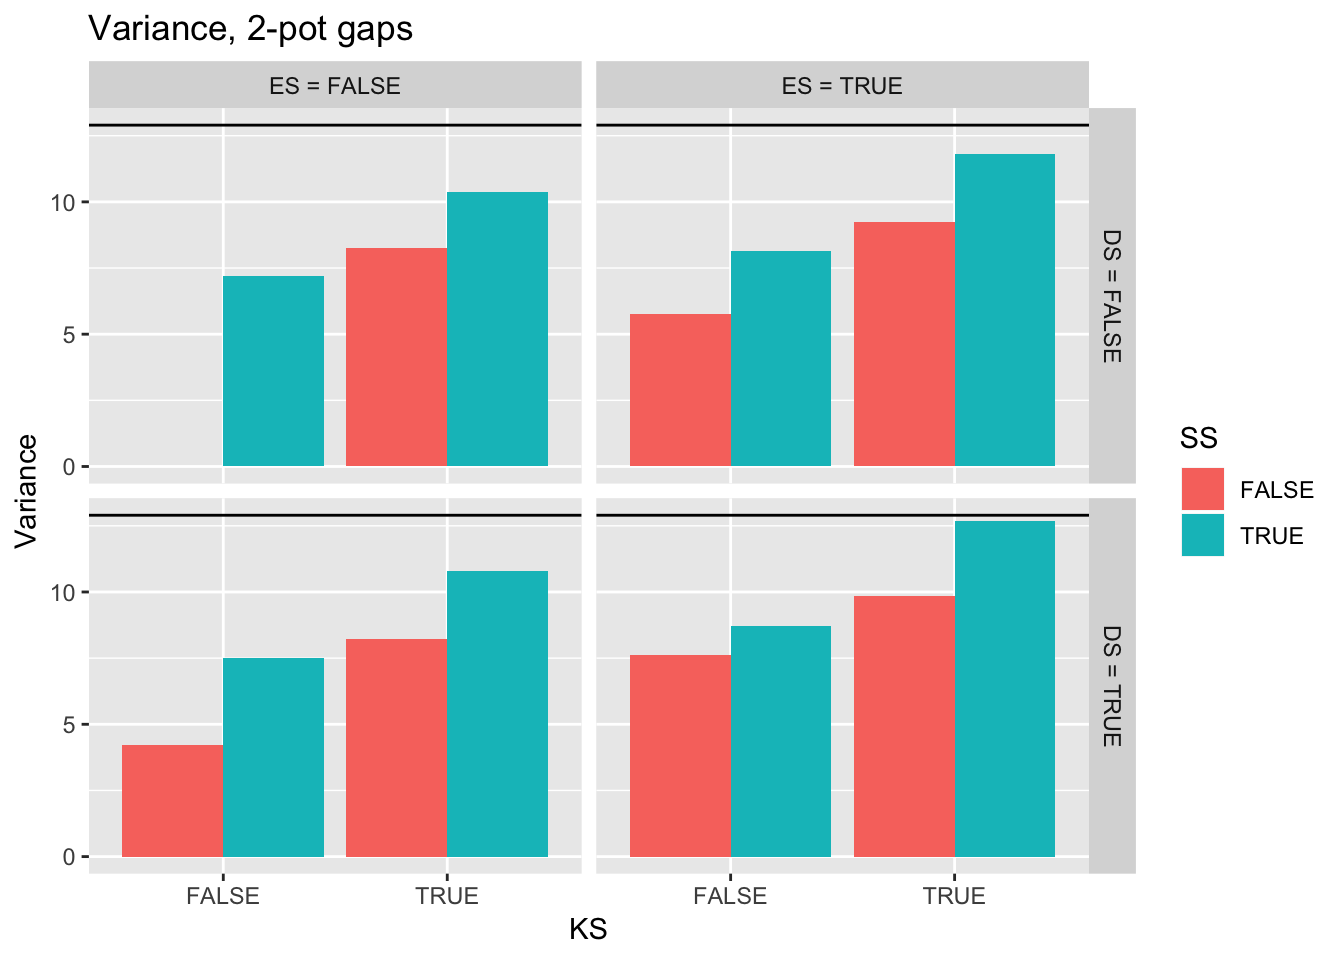
ggplot(filter(Ler_summ, Gap == 3),
       aes(y = Mean, x = KS, fill = SS)) +
  geom_bar(position="dodge", stat="identity") +
  facet_grid(DS2 ~ ES2) +
  ggtitle("Mean, 3-pot gaps") +
  geom_hline(yintercept = pull(filter(real_stats, Gap == "3p"), Mean))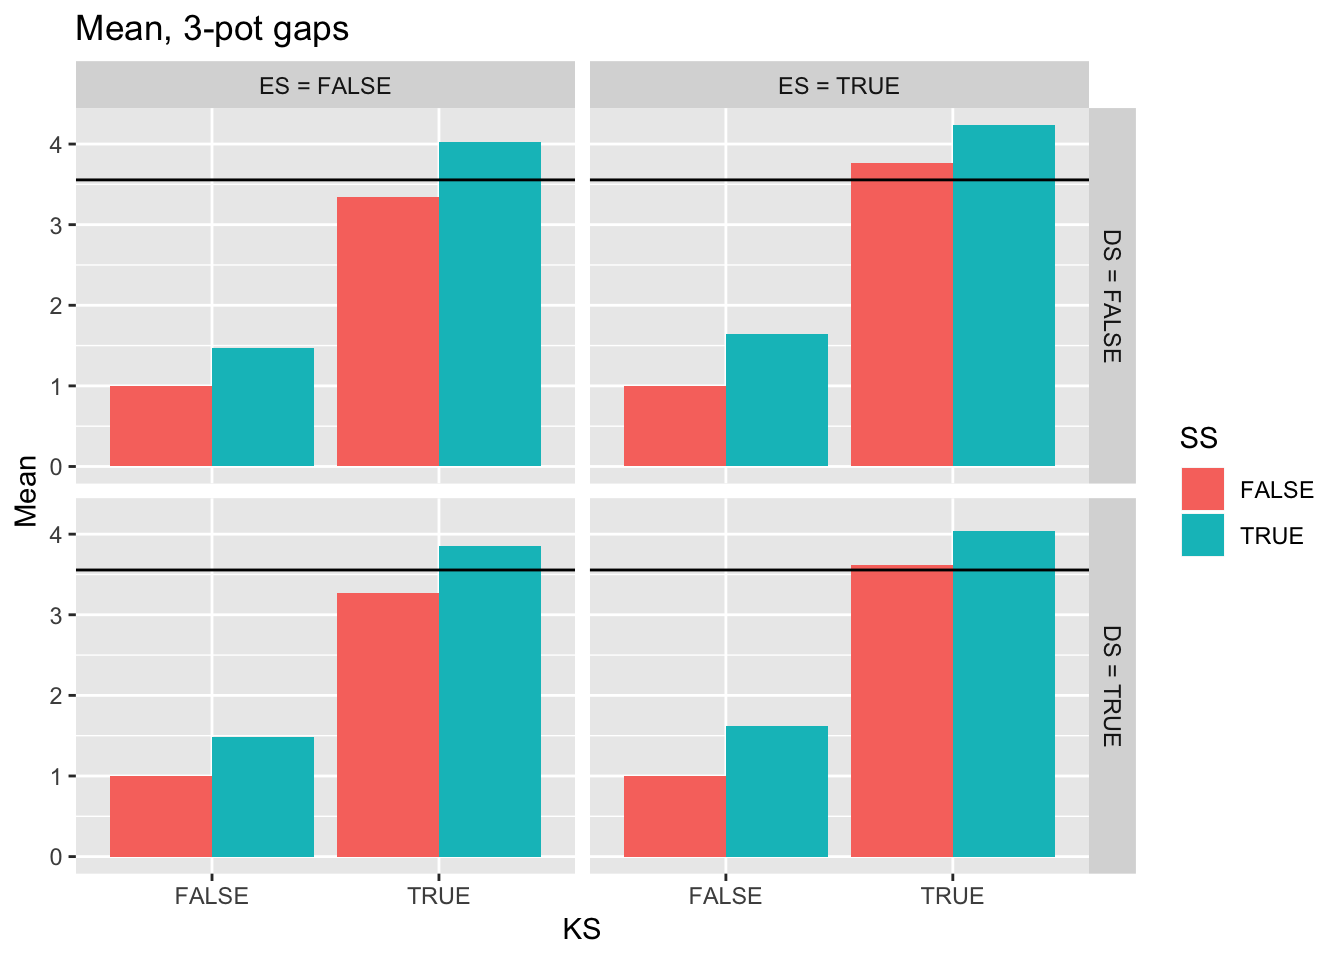
ggplot(filter(Ler_summ, Gap == 3),
       aes(y = Variance, x = KS, fill = SS)) +
  geom_bar(position="dodge", stat="identity") +
  facet_grid(DS2 ~ ES2) +
  ggtitle("Variance, 3-pot gaps") +
  geom_hline(yintercept = pull(filter(real_stats, Gap == "3p"), Var))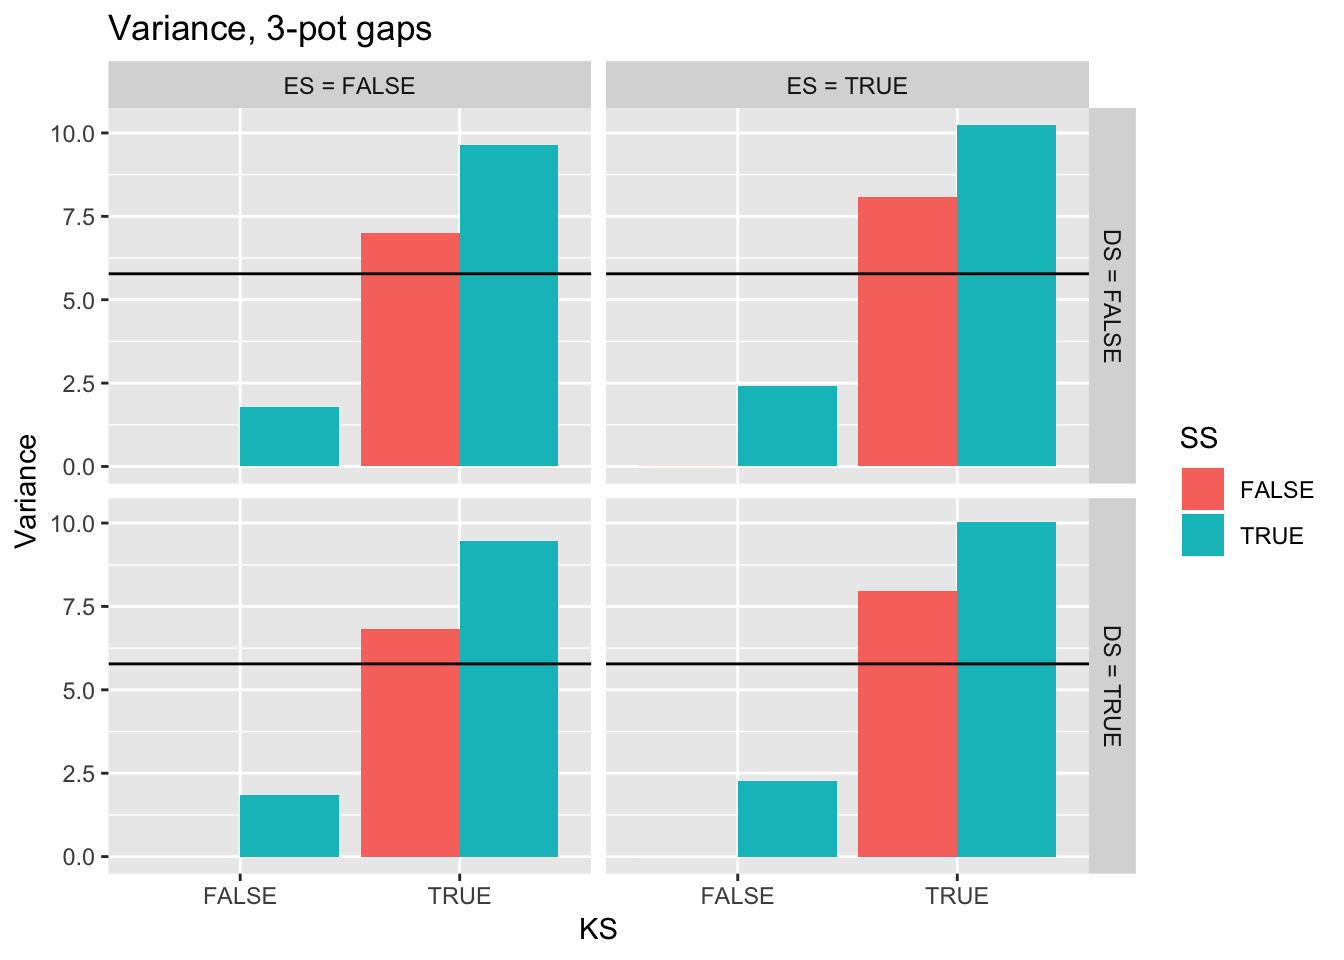
RIL parameterization
Jenn’s code for fitting kernels to the sticky paper data is in FitKernels_RILs_13Aug2015.R. The data file is 2015_06_30_RilsDispersal.csv. I think that it has a similar shape as the Ler dispersal experiment, so hopefully I can adapt the code quickly.
For seed production, there exists \(a\) and \(b\) for each RIL. Initially I thought I could use those directly, but I realized that these are probably not from the Gompertz model. I also don’t know if the intercept is adjusted to account for dispersing seeds. So I may need to find the data and re-fit. At the very least, I need to find the code that generated these estimates.
OK, I’ve dug things up. a_seed and b_seed are the Gompertz parameters, taking into account dispersal (“effective seed number”). So I can use those. I’ve put the relevant file into the data directory, so it will be auto-loaded as RIL_stats.
For stochasticity, I’ll just use the variance inflation factor for DS and spatiotemporal variances for ES that I derived for Ler. Perhaps there is sufficient data to get at the VIF, but since we can’t get at RIL-specific seed production in the populations, there is no way to see the ES variance.
So the only real chore is to fit the dispersal data.